
Alberta’s disclosed venture capital fell 62.7% in H1 2026 (January–June), even as Canada’s total rose 9.5%. A stronger national total therefore gives an incomplete picture of financing in Alberta.
For founders, investors, and program teams, the important question is what sits behind that gap. Alberta recorded less money and fewer deals, but the dollar decline was much sharper. Looking at both measures helps distinguish a change in the money reported from a change in the number of transactions.
Alberta’s dollars fell faster than its deal count
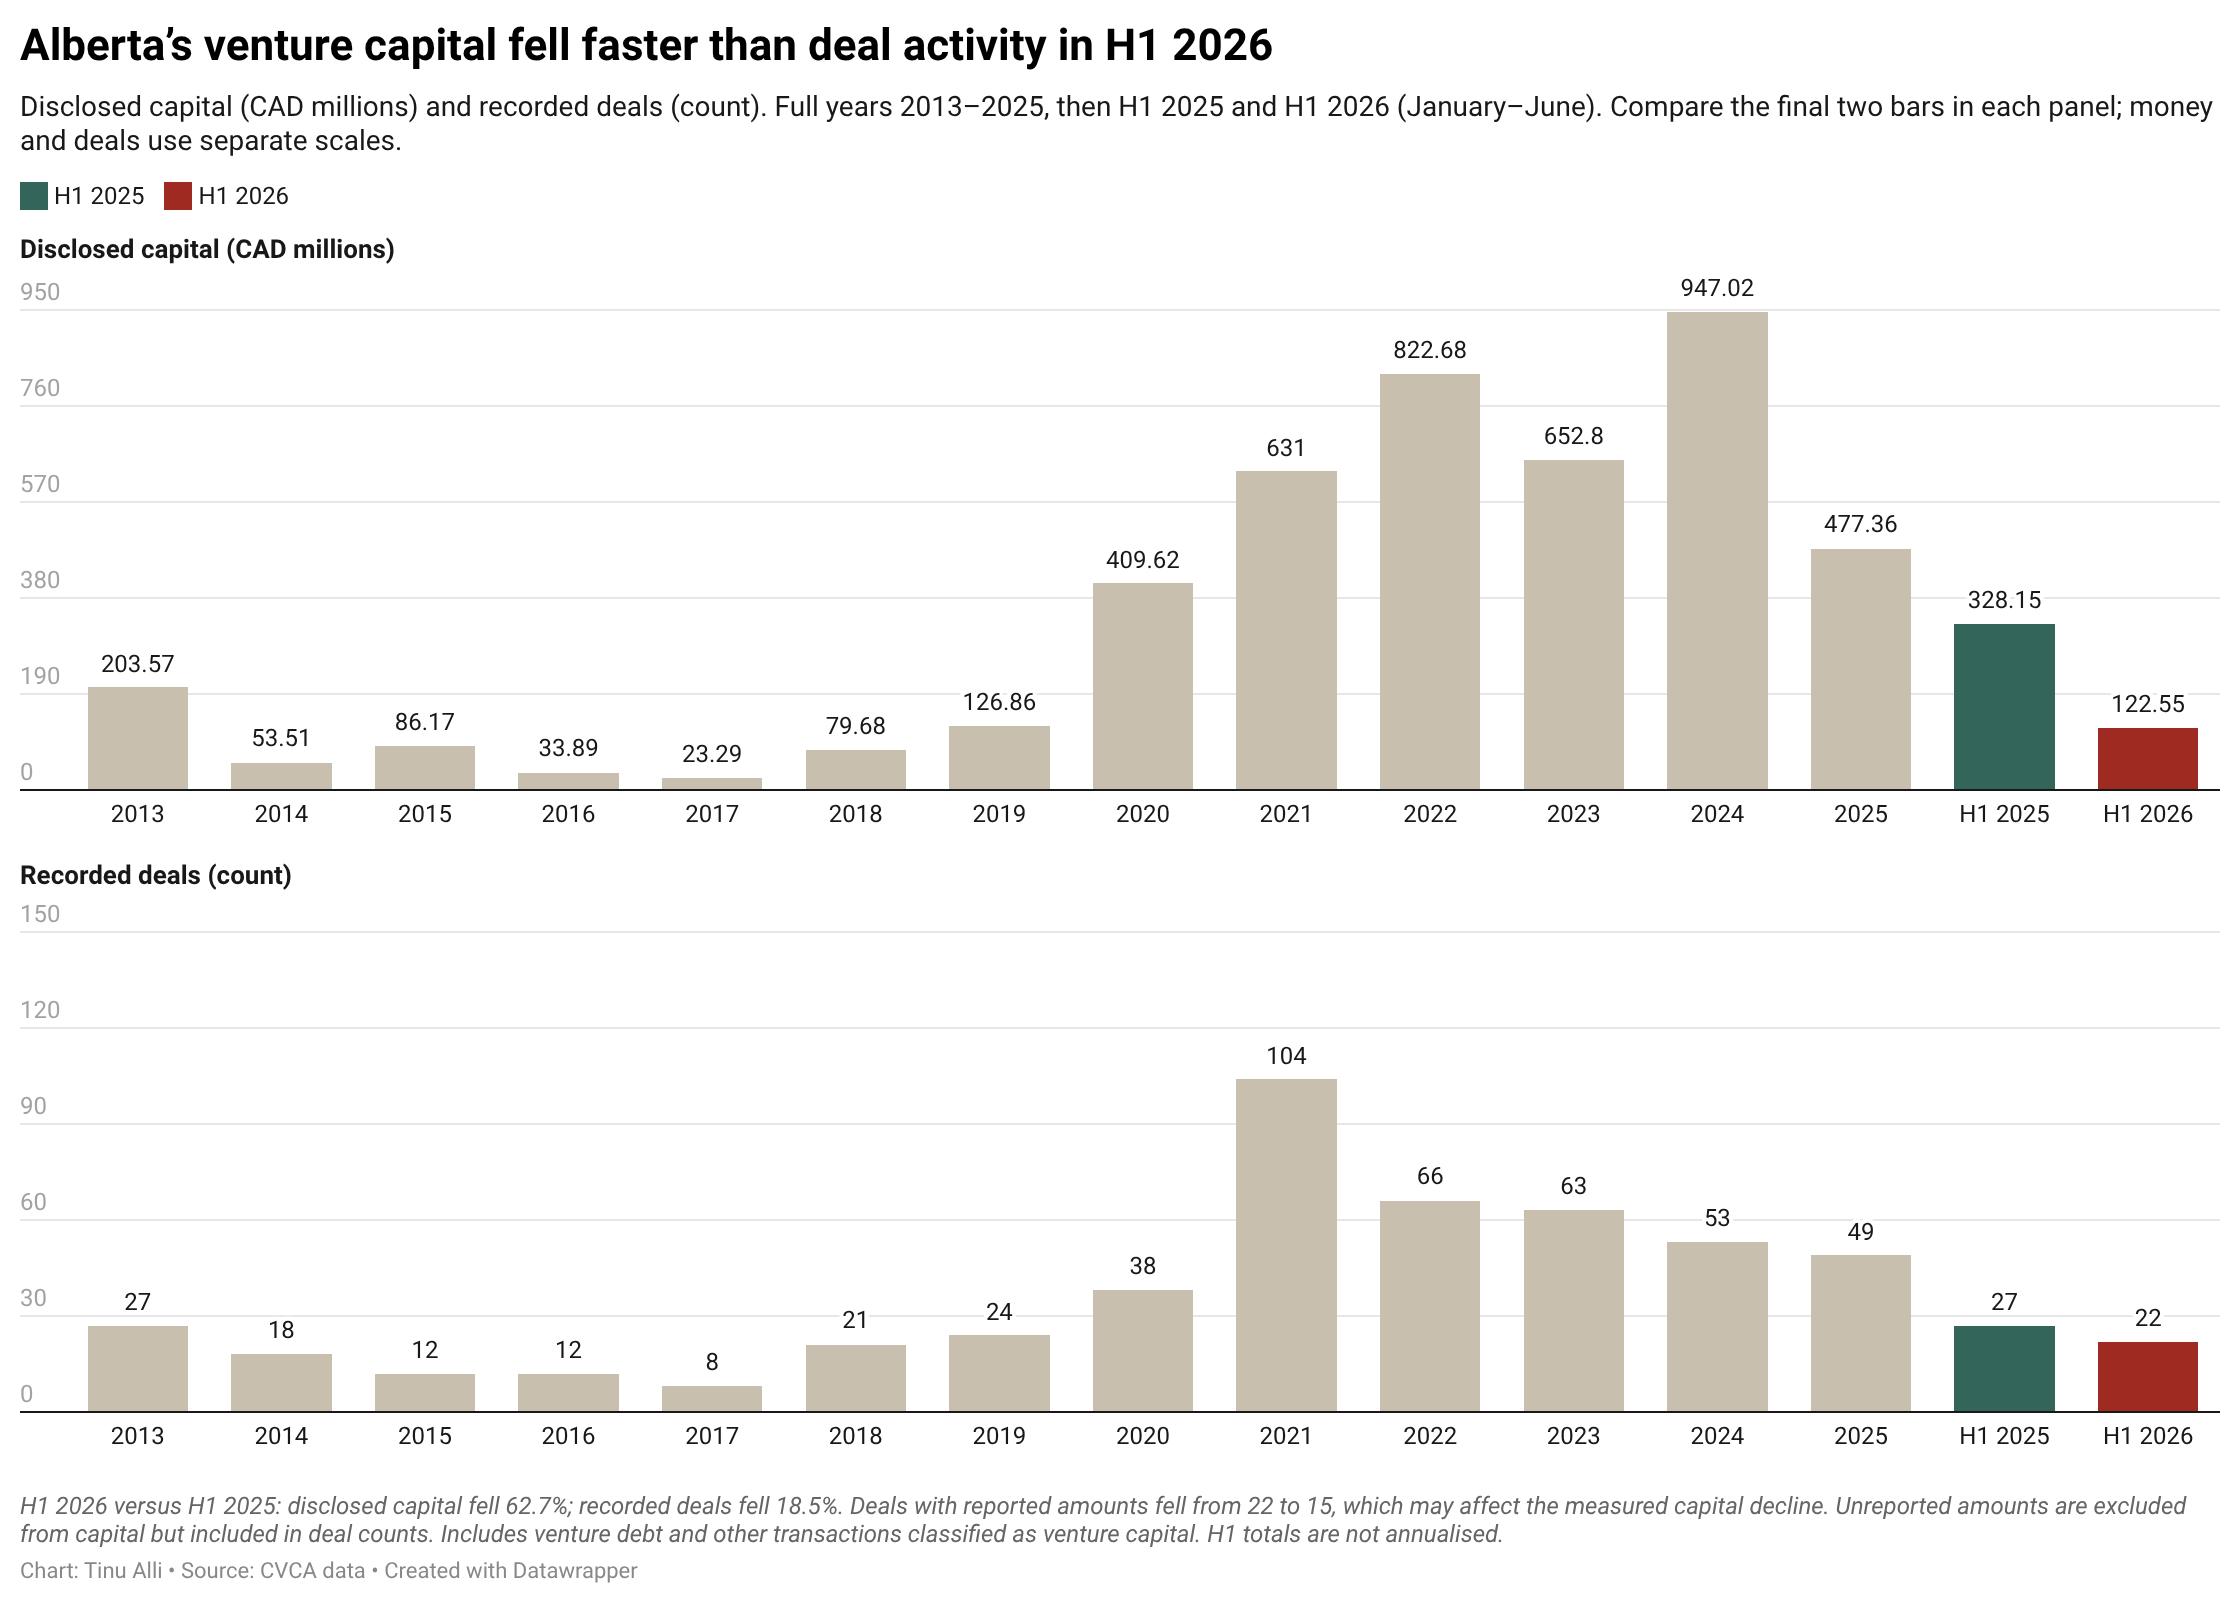
Disclosed capital means money raised in deals where the amount was reported. Alberta recorded $122.5 million across 22 deals in H1 2026, compared with $328.2 million across 27 deals in H1 2025. Deal count fell 18.5%. All dollar figures here are Canadian dollars.
Only 15 of the 22 deals in H1 2026 had reported amounts, compared with 22 of 27 a year earlier. Missing amounts are excluded from capital totals but included in deal counts. This change in reporting coverage may affect the measured dollar decline.
Compare the final two bars in each panel below: money fell faster than deal activity.
View Alberta’s interactive chart
Alberta’s H1 capital decline was sharper than its decline in deal activity. Unreported amounts are excluded from capital but included in deal counts.
Canada raised more money across fewer deals
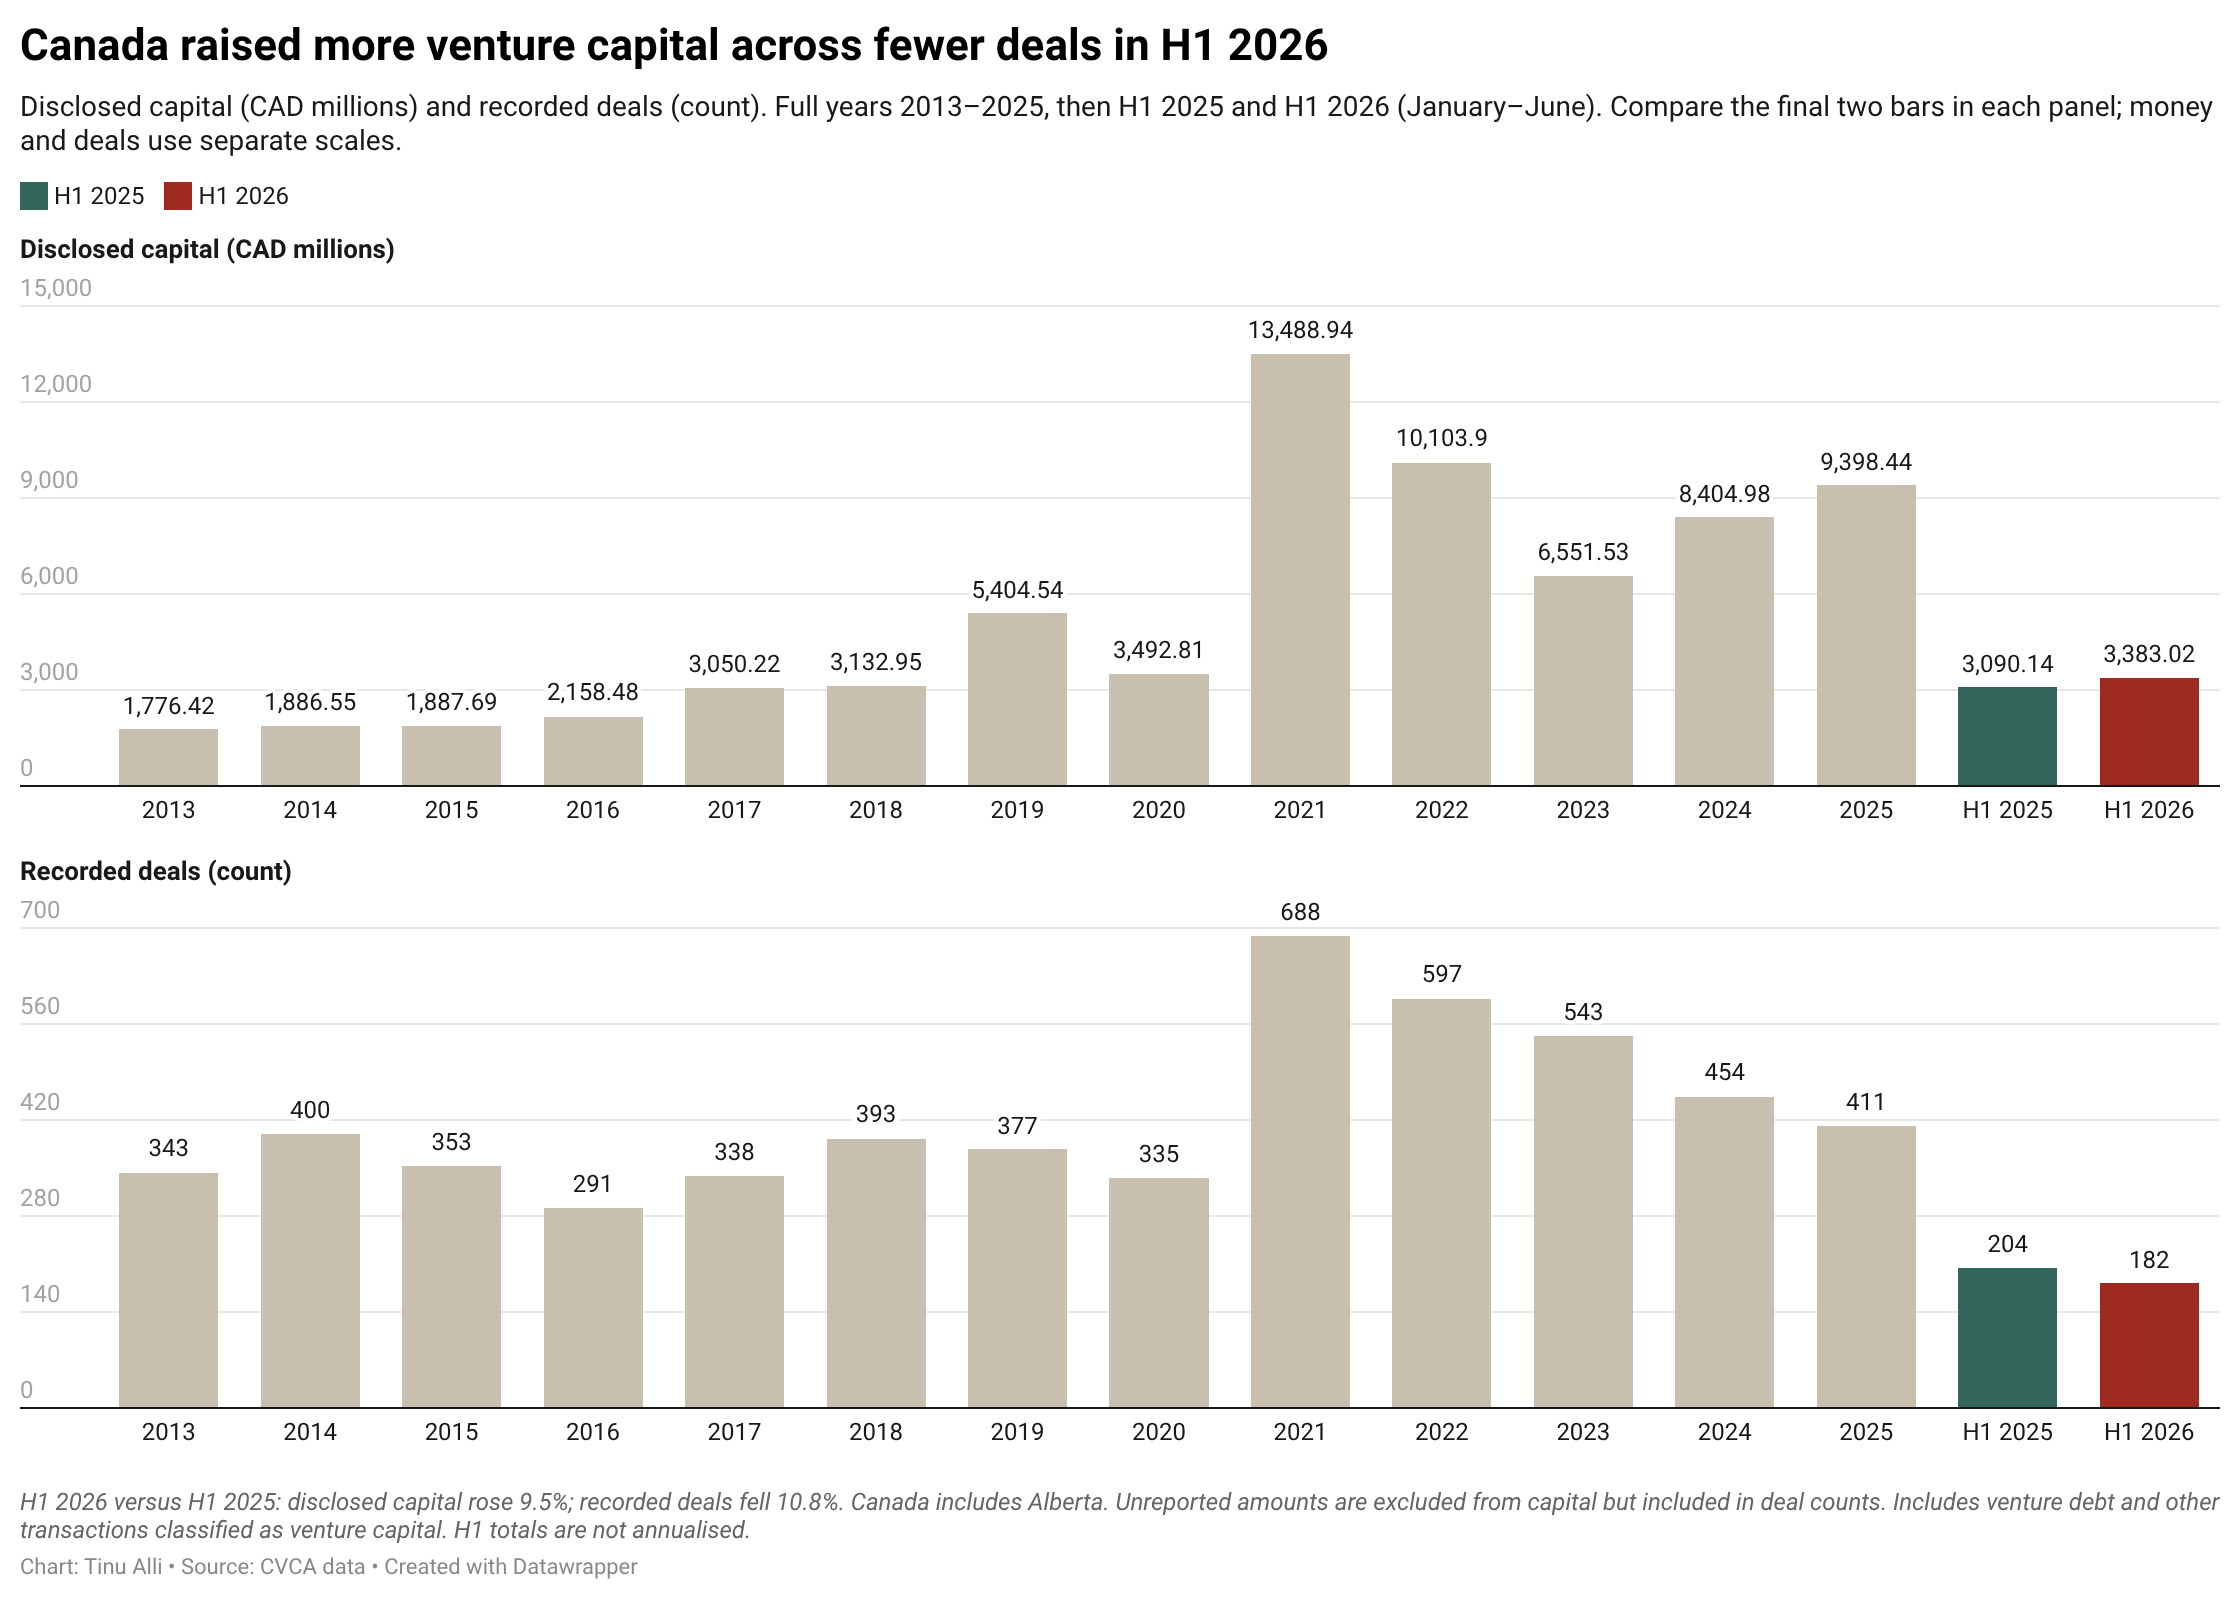
Canada recorded $3,383.0 million in disclosed capital across 182 deals in H1 2026, compared with $3,090.1 million across 204 deals a year earlier. Capital rose 9.5%; deal count fell 10.8%. The final two bars in each panel show the difference: more money did not mean more transactions.
View Canada’s interactive chart
Canada raised more disclosed capital across fewer recorded deals in H1 2026. The national total includes Alberta.
Canada includes Alberta. Alberta’s share of the national disclosed capital total fell from 10.6% to 3.6%. Excluding Alberta, capital in the rest of Canada rose 18.0%. National growth tells us little about whether financing became easier to secure in the province.
Read the charts using their labels: dollars and deals have separate scales, and Alberta and Canada use different vertical ranges. Both charts show full years 2013–2025, followed by January–June 2025 and 2026. Compare the two half-years with each other, not with a full year.
The difference began before 2026
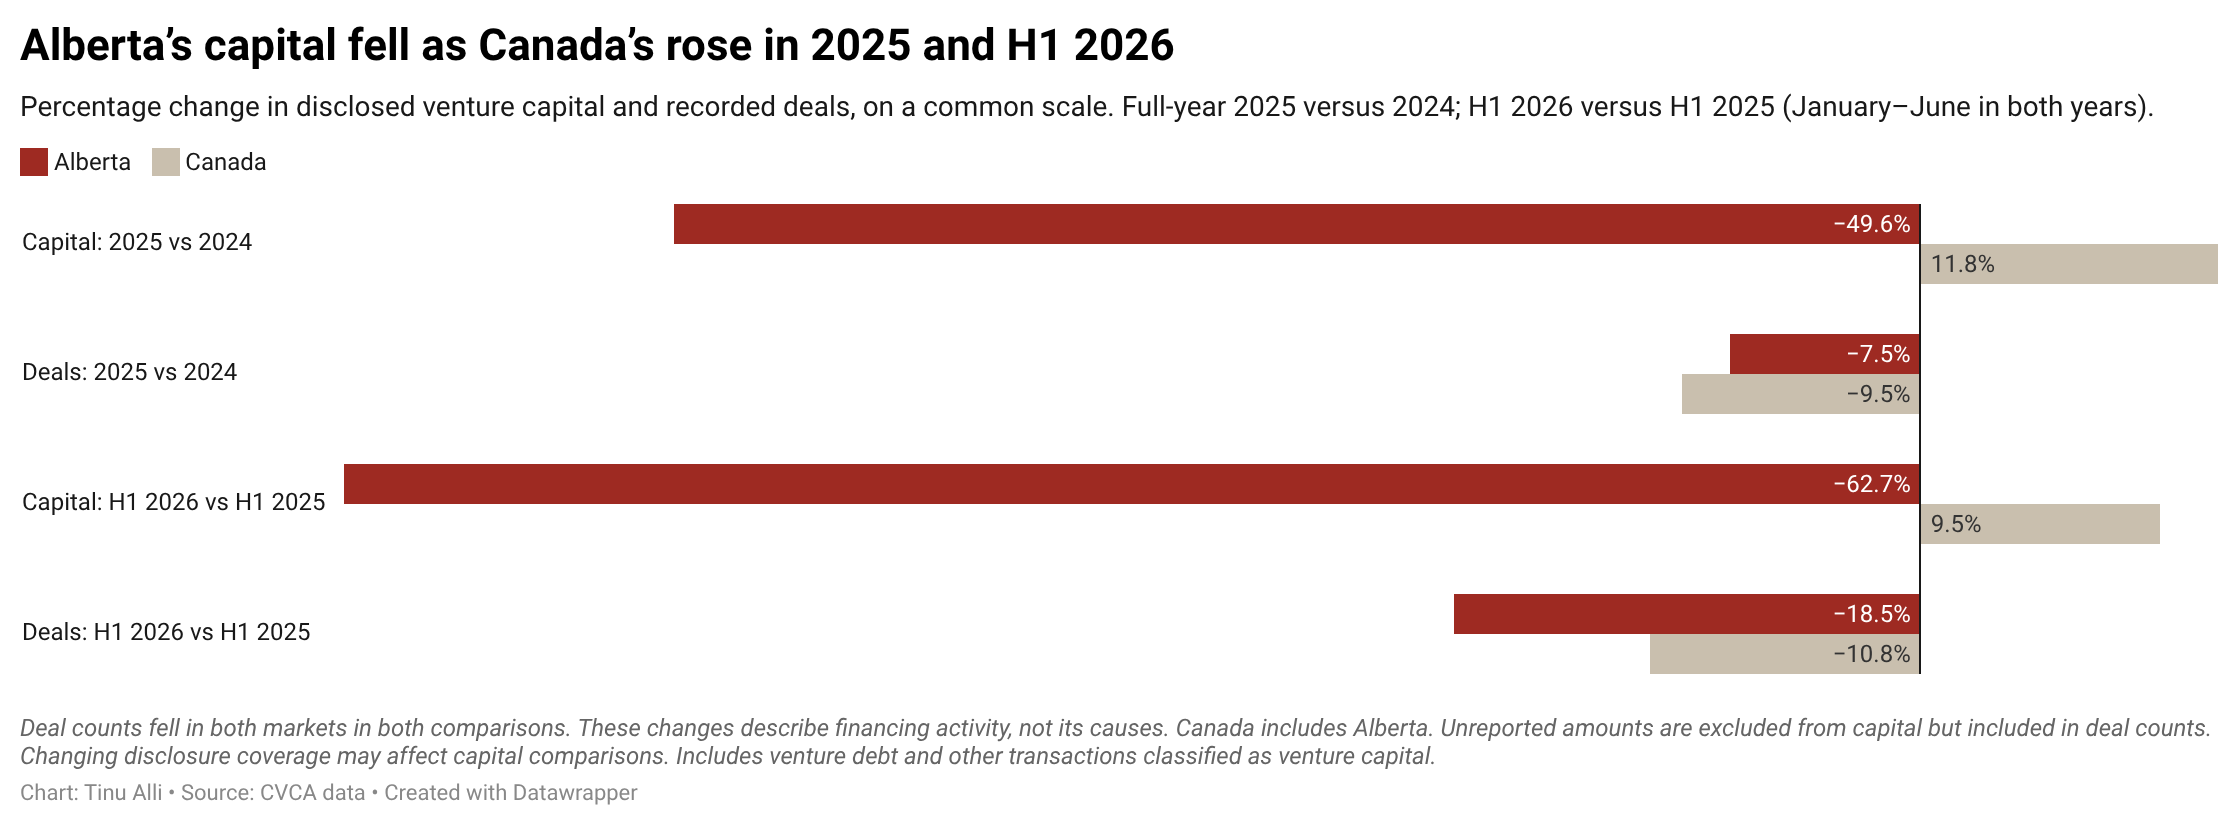
The same pattern appeared in 2025. Alberta’s disclosed capital fell 49.6%, from $947.0 million in 2024 to $477.4 million. Canada’s rose 11.8%, from $8,405.0 million to $9,398.4 million. Deal counts fell in both markets: 7.5% in Alberta and 9.5% nationally. The next chart puts these changes on a common percentage scale.
View the interactive percentage-change chart
Alberta’s capital fell as Canada’s rose in both matched comparisons. Each row compares equivalent periods; H1 means January–June.
Large deals account for much of the annual decline
A few large transactions can change the capital total substantially without changing deal count much. Alberta’s annual figures show how much this matters, although they do not establish why the market changed.
In 2024, three transactions totalled $592.1 million, or 62.5% of Alberta’s disclosed capital: Neo Financial’s $250 million venture debt transaction, ClearSky’s $230.1 million transaction, and Neo Financial’s $112 million Series D round. These involved two companies. Venture debt is a loan, so the total includes more than equity investment.
The three largest deals in 2025 totalled $234.5 million: Eavor at $89 million, Canadian Fiber Optics at $85 million, and GeologicAI at $60.5 million. The difference between the two top-three totals accounts for about 76% of Alberta’s annual capital decline.
The decline extended beyond those deals: capital outside each year’s largest three fell from $354.9 million to $242.9 million. This breakdown compares different transactions each year. It does not explain investor motives or the H1 2026 decline.
Source and scope
CVCA data. Capital totals sum disclosed amounts; deal counts include transactions with undisclosed amounts. Records classified as venture capital also include venture debt, financing tied to Scientific Research and Experimental Development (SR&ED) tax credits, and other transaction types. These totals are broader than equity rounds alone.
Annual changes compare full-year 2025 with 2024. Half-year changes compare January–June 2026 with January–June 2025. No annual forecast is implied.
Look beyond the national total
For program teams and investors, the next step is to compare company stage, sector, debt or equity, and the share of money in the largest transactions. Check reporting coverage too. These distinctions matter when deciding what support to investigate: a shift in large loans raises different questions from a fall in equity funding for young companies.
The figures do not establish unmet demand, investor motives, or company performance. Evidence on what Alberta companies sought and secured would help distinguish changes in deal timing from a persistent financing gap. That is the practical task: assess Alberta’s funding needs through its dollars, deals, and financing types together. Canada’s rising total cannot answer the provincial question on its own.